3 Fib Strategy – Automatic Trend Fib Extension ConfluenceWhat This Script Does
✔ Auto-detects swing highs and lows
Using pivot detection, adjustable by the user.
✔ Builds 3 independent trend-based Fib extension projections
Measures:
Wave 1 → Wave 2 → Wave 3
Wave 2 → Wave 3 → Wave 4
Wave 3 → Wave 4 → Wave 5
✔ Calculates the exact fib levels:
1.0 (1:1 extension)
1.236 extension
1.382 extension
✔ Detects confluence zones
When all 3 fib measurement sets overlap at the same target:
Green label = 1:1 confluence
Orange label = 1.236–1.382 confluence
✔ Draws long dotted lines across the chart
So you can visually track confluence zones.
Cari dalam skrip untuk "swing high"

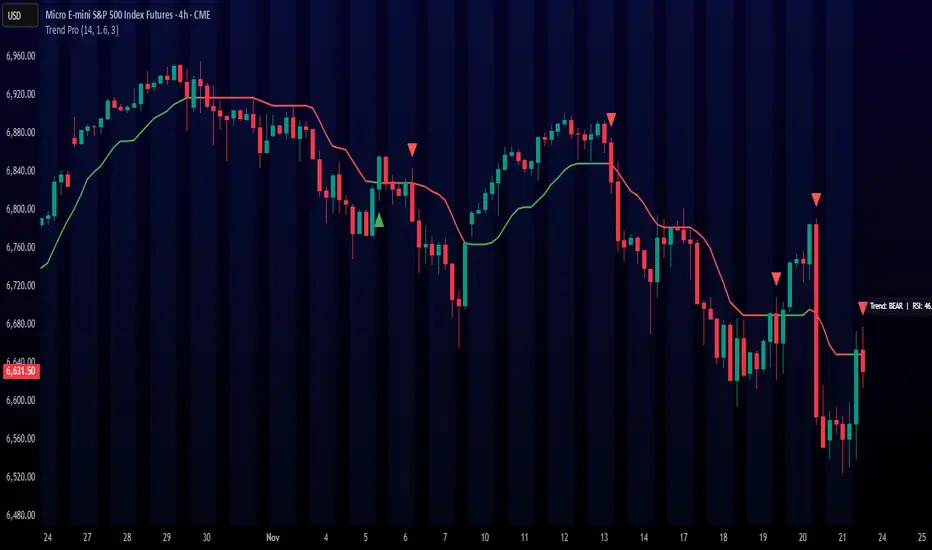
Trend ProTrend Pro is a volatility-adaptive trend and momentum system designed for scalping, day trading, and short-term swing trading.
It uses an ATR-based dynamic trend line (Alpha-Trend style) to identify momentum shifts and confirm directional strength.
Unlike traditional moving averages, Trend Pro adapts to volatility and reacts faster during expansions while filtering noise during chop.
🔍 How Trend Pro Works
Trend Pro builds a dynamic volatility channel using ATR and tracks whether price stays above or below this adaptive line.
When price crosses and closes on the opposite side, it suggests a shift in market control.
When price closes above the line → the trend turns BULLISH (green)
When price closes below the line → the trend turns BEARISH (red)
This gives a clear, visual trend state without repainting.
Tips for Best Performance:
✔ Avoid signals directly inside major ranges or sideways chop
✔ Strongest entries come after small pullbacks into the line
✔ Combine signals with:
Market structure
Key swing highs/lows
Liquidity sweeps
Session timing (NYSE open, power hour)
✔ Trend Pro works best when used with the trend, not counter-trend
Enjoy!
The Ultimate Price Action & SMC Toolkit: Delta Zones, MTF IndicaThis is an All-in-One Pine Script indicator that seamlessly combines three advanced trading concepts:
Delta Zones (Wick Pressure): Uses Standard Deviation to identify extreme buying/selling pressure within the candlestick wicks, signaling potential stop hunts or liquidity absorption. These are plotted as critical Buy/Sell Boxes.
Multi-Timeframe (MTF) Indicators: Confirms signals using popular indicators (RSI, CCI, Stochastic) calculated from a separate, user-selected Timeframe or the current chart timeframe. This adds a crucial layer of context and momentum confirmation.
Smart Money Concepts (SMC): Automatically detects and plots Orderblocks (OBs) and Breaker Blocks based on confirmed Market Structure Breaks (MSB). This helps locate high-probability Supply and Demand zones.
Key Features:
Integrated plotting for combined indicator signals.
Flexible MTF selection for all standard oscillators.
Automatic Swing High/Low detection for SMC analysis.
Comprehensive Alert system for Delta Pressure, Orderblocks, and Breaker Zones.
Option 2: Focusing on SMC and Flow (Concise)
Title: "SMC Delta Flow: Advanced Orderblock, Breaker, and Wick Reversal Zones with MTF Filter."
Description:
An essential tool for sophisticated SMC traders. This indicator provides high-precision zones:
Smart Money Blocks: Plots Orderblocks and Breaker Blocks following Market Structure Shifts (MSS). Includes a "Chop Control" feature to invalidate re-used or weak Breakers.
Delta Reversal Zones: Pinpoints candles showing extreme high-deviation wick pressure. Use these zones to confirm reversals and identify precise entry points where liquidity was captured.
MTF Confirmation: Incorporates configurable Multi-Timeframe (MTF) RSI, CCI, and Stochastic indicators to act as a momentum filter or confirmation tool.
Add this indicator to unify your analysis of Liquidity, Market Structure, and Momentum on a single chart!
SMC, SmartMoneyConcepts, Orderblock, BreakerBlock, MTF, MultiTimeframe, Delta, Wick, Liquidity, PriceAction, RSI, Stochastic, CCI

Auto Fibonacci Retracement (Labeled Swings, Rounded Prices)This tool automatically detects the latest confirmed swing high and swing low on your chart, using a user-settable pivot length. It then plots standard Fibonacci retracement levels between these confirmed pivots, labeling each retracement line with its percentage and rounded price for instant reference. All levels update only on swing confirmation, ensuring strict non-repainting logic and transparency.
How it works
Swing Detection:
Uses Pine Script’s native ta.pivothigh and ta.pivotlow functions to locate swing pivots after full confirmation, reducing noise and false signals.
Fibonacci Calculation:
Once two confirmed swings are found, the script draws standard Fibonacci retracement levels (0%, 23.6%, 38.2%, 50%, 61.8%, 78.6%, 100%) between these anchors. The levels adapt to both uptrends and downtrends, based on swing position.
Customization and Clarity:
Users can choose which retracement levels to display and adjust colors, line thickness, styles, and label sizes for chart clarity. All price labels are rounded for improved visibility.
Non-Repainting:
All levels are plotted only after a swing is confirmed by the market; nothing redraws retroactively.
How To Use It
Add the indicator to any chart and timeframe.
Select your preferred pivot length:
Smaller values yield more frequent swings, larger values wait for major structure.
Toggle each Fibonacci level you wish to see in the settings.
Adjust line and label appearance to fit your style.
Interpret retracement levels as potential support/resistance zones, awareness for pullbacks, and context for trend direction.
Combine the indicator with your technical, price action, or volume analysis to plan entries, stops, and targets.
What Traders Should Look For
Visual retracement map between confirmed swings:
Fib lines auto-update as new swings are confirmed, keeping your chart relevant.
Price reaction at Fib levels:
Watch for reversals, consolidations, or continuations near labeled percentages and prices.
Trend assessment:
Quickly spot whether market structure is showing shallow or deep retracements by the distance between levels.
Confluence:
Use retracement levels along with other indicators or market structure for more robust trade setups.
Key Features
Strict non-repainting logic (confirmed swings only)
Configurable retracement levels: Enable/disable each Fib line.
Rounded price & percentage labels
Visual customization: Colors, thickness, line style, label size
Automatic detection of direction (uptrend/downtrend pivots)
Disclaimer
This indicator is a technical analysis and educational tool. It does not provide buy/sell signals, nor guarantee future price movements. Please use in conjunction with your trading plan and risk management.

Dual EMA Status Table (15m & 30m)It checks whether the 9 EMA is above or below the 21 EMA on:
the 15-minute chart, and
the 30-minute chart,
and then displays their alignment in a table:
Timeframe 9 vs 21 Status
15 min 9 > 21 Bullish
30 min 9 > 21 Bullish
CONFIRM ✅ Bullish
✅ “Bullish Confirm” → 9 EMA > 21 EMA on both → uptrend bias
❌ “Bearish Confirm” → 9 EMA < 21 EMA on both → downtrend bias
⚠️ “Mixed” → 15 m and 30 m disagree → stay neutral or wait
💡 How to Use It as a Trading Signal
You can treat it as a buy/sell framework with confirmation rules:
🔹 Buy (Long) bias
Table shows ✅ Bullish confirmation
9 EMA > 21 EMA on both timeframes
Ideally, price pulls back near one of the EMAs and then bounces
You could enter after a bullish candle close above the EMAs
📍 Example entry rule:
Enter long when “✅ Bullish” appears and price closes above both EMAs on the 15 min chart.
Stop-loss below the 21 EMA or recent swing low.
🔹 Sell (Short) bias
Table shows ❌ Bearish confirmation
9 EMA < 21 EMA on both timeframes
Price retraces upward and rejects near EMAs
📍 Example entry rule:
Enter short when “❌ Bearish” appears and price closes below both EMAs on the 15 min chart.
Stop-loss above 21 EMA or recent swing high.

Trend Break + MSB + Fibo Zone [v1.0] dnmSure! Here’s the English translation of your text:
---
Swings are determined based on the HH/LL structure.
If the candle close breaks the swing level, the MSB (Market Structure Break) is confirmed.
After the MSB, the last swing high/low is used to calculate the Fibonacci 0.5 and 0.618 levels.
On the chart, the 0.5–0.618 range is displayed as a colored box.
A green box appears for a bullish break, and a red box appears for a bearish break.

FU Candle Detector (Smart Money Concept) En Anglais🧠 Overall concept: “FU Candle” in Smart Money logic
In the context of Smart Money Concepts (SMC) or ICT (Inner Circle Trader), an FU Candle (also known as a “Fakeout Candle” or “Manipulation Candle”) is a candle that:
Creates an imbalance or a break (often above a swing high or below a swing low),
Attracts liquidity by trapping retail traders (liquidity grab),
Then abruptly reverses direction, revealing the hand of “Smart Money” (large institutions).
It therefore often marks:
The point of manipulation before an impulsive movement (reversal),
An area of interest for entering in the institutional direction (after the liquidity grab).
---
⚙️ How the “FU Candle Detector” script works
The script identifies these candlesticks by observing several typical criteria:
1. Detection of the manipulative candle (FU Candle)
Search for a candlestick that breaks a previous swing (significant high or low),
But closes in the opposite direction, often below/above the broken zone,
Thus indicating a fakeout.
Examples:
Bullish FU Candle: breaks a previous low, but closes bullish.
Bearish FU Candle: breaks a previous high, but closes bearish.
---
2. Visualization on the chart
The script generally displays:
🔴 Red markers for bearish FUs (Fake Breakout upwards),
🟢 Green markers for bullish FUs (Fake Breakout downwards),
🟦 Rectangles of areas of interest (often around the FU Candle Open),
📏 Horizontal lines on areas of imbalance (OB/FVG if integrated).
---
3. Possible additions depending on the version
Depending on the version you have received, the script can also:
Detect Fair Value Gaps (FVG) around FU Candles,
Mark Order Blocks (OB) associated with manipulation,
Add alerts when new FU Candles are detected,
Calculate the distance between the manipulation point and the price return,
Filter according to candle size, volume, or market structure (MSB/CHoCH).
---
🎯 Practical use
FU Candles are often used:
As confirmation of an imminent reversal,
To identify institutional entry zones (hidden Order Block),
To anticipate the direction of the next impulse after the liquidity hunt.
Typical entry example:
> Wait for the formation of an FU Candle + price return within the candle body = entry in the opposite direction to the false breakout.
📈 Recommended combinations
This detector is often combined with:
Structure Break Indicator (CHoCH / BOS)
Liquidity Pool Zones
Fair Value Gap Finder
Order Block Detector
This gives you a complete Smart Money Concept system, capable of mapping:
1. Where liquidity has been taken,
2. Where the price is rebalancing,
3. Where Smart Money is repositioning its orders.

ORDER BLCOK custom strategy# OB Matrix Strategy - Documentation
**Version:** 1.0
**Author:** HPotter
**Date:** 31/07/2017
The **OB Matrix Strategy** is based on the identification of **bullish and bearish Order Blocks** and the management of conditional orders with multiple Take Profit (TP) and Stop Loss (SL) levels. It uses trend filters, ATR, and percentage-based risk management.
---
## 1. Main Parameters
### Strategy
- `initial_capital`: 50
- `default_qty_type`: percentage of capital
- `default_qty_value`: 10
### Money Management
- `rr_threshold`: minimum Risk/Reward threshold to open a trade
- `risk_percent`: percentage of capital to risk per trade (default 2%)
- `maxPendingBars`: maximum number of bars for a pending order
- `maxBarsOpen`: maximum number of bars for an open position
- `qty_tp1`, `qty_tp2`, `qty_tp3`: quantity percentages for multiple TPs
---
## 2. Order Block Identification
### Order Block Parameters
- `obLookback`: number of bars to identify an Order Block
- `obmode`: method to calculate the block (`Full` or `Breadth`)
- `obmiti`: method to determine block mitigation (`Close`, `Wick`, `Avg`)
- `obMaxBlocks`: maximum number of Order Blocks displayed
### Main Variables
- `bullBlocks`: array of bullish blocks
- `bearBlocks`: array of bearish blocks
- `last_bull_volume`, `last_bear_volume`: volume of the last block
- `dom_block`: dominant block type (Bullish/Bearish/None)
- `block_strength`: block strength (normalized volume)
- `price_distance`: distance between current price and nearest block
---
## 3. Visual Parameters
- `Width`: line thickness for swing high/low
- `amountOfBoxes`: block grid segments
- `showBorder`: show block borders
- `borderWidth`: width of block borders
- `showVolume`: display volume inside blocks
- `volumePosition`: vertical position of volume text
Customizable colors:
- `obHighVolumeColor`, `obLowVolumeColor`, `obBearHighVolumeColor`, `obBearLowVolumeColor`
- `obBullBorderColor`, `obBearBorderColor`
- `obBullFillColor`, `obBearFillColor`
- `volumeTextColor`
---
## 4. Screener Table
- `showScreener`: display the screener table
- `tablePosition`: table position (`Top Left`, `Top Right`, `Bottom Left`, `Bottom Right`)
- `tableSize`: table size (`Small`, `Normal`, `Large`)
The table shows:
- Symbol, Timeframe
- Type and status of Order Block
- Number of retests
- Bullish and bearish volumes
---
## 5. Trend Filters
- EMA as a trend filter (`emaPeriod`, default 223)
- `bullishTrend` if close > EMA
- `bearishTrend` if close < EMA
---
## 6. ATR and Swing Points
- ATR calculated with a customizable period (`atrLength`)
- Swing High/Low for SL/TP calculation
- `f_getSwingTargets` function to calculate SL and TP based on direction
---
## 7. Trade Logic
### Buy Limit on Bullish OB
- Conditions:
- New bullish block
- Uptrend
- RR > threshold (`rr_threshold`)
- SL: `bullishOBPrice * (1 - atr * atrMultiplier)`
- Multiple TPs: TP1 (50%), TP2 (80%), TP3 (100% max)
- Quantity calculation based on percentage risk
### Sell Limit on Bearish OB
- Conditions:
- New bearish block
- Downtrend
- RR > threshold (`rr_threshold`)
- SL: `bearishOBPrice * (1 + atr * atrMultiplier)`
- Multiple TPs: TP1 (50%), TP2 (80%), TP3 (100% max)
- Quantity calculation based on percentage risk
---
## 8. Order Management and Timeout
- Close pending orders after `maxPendingBars` bars
- Close open positions after `maxBarsOpen` bars
- Label management for open orders
---
## 9. Alert Conditions
- `bull_touch`: price inside maximum bullish volume zone
- `bear_touch`: price inside maximum bearish volume zone
- `bull_reject`: confirmation of bullish zone rejection
- `bear_reject`: confirmation of bearish zone rejection
- `new_bull`: new bullish block
- `new_bear`: new bearish block
---
## 10. Level Calculation
- Swing levels based on selected timeframe (`SelectPeriod`)
- `xHigh` and `xLow` for S1 and R1 calculation
- Levels plotted on chart
---
## 11. Take Profit / Stop Loss
- Extended horizontal lines (`extendBars`) to visualize TP and SL
- Customizable colors (`tpColor`, `slColor`)
---
## 12. Notes
- Complete script based on Pine Script v5
- Advanced graphical management with boxes, lines, labels
- Dynamically displays volumes and Order Blocks
- Integrated internal screener
---
### End of Documentation

Alt buy signal 1H Entry + 4H Confirm (MACD + Stoch RSI + HMA)This indicator is a multi-timeframe (MTF) analysis tool designed for the ALT trading , capturing entry signals on the 1-hour (1H) timeframe and confirming trends on the 4-hour (4H) timeframe. It combines MACD, Stoch RSI, and Hull Moving Average (HMA) to identify precise buy opportunities, particularly at reversal points after a downtrend or during trend shifts. It visually marks both past and current BUY signals for easy reference.
Key Features:
1H Entry Signal (Early Ping): Triggers on a MACD golden cross (below 0) combined with a Stoch RSI oversold cross (below 20), offering an initial buy opportunity.
4H Trend Confirmation (Entry Ready): Validates the trend with a 4H MACD histogram rising (in negative territory) or a golden cross, plus a Stoch RSI turn-up (above 30).
Past BUY Display: Labels past data points where these conditions were met as "1H BUY" or "FULL BUY," facilitating backtesting.
HMA Filter: Optional HMA(16) to confirm price breakouts, enhancing trend validation.
Purpose: Ideal for short-term scalping and swing trading. Supports a two-step strategy: initial partial entry on 1H signals, followed by additional entry on 4H confirmation.
Usage Instructions
Installation: Add the indicator to an IMX/USDT 1H chart on TradingView.
Signal Interpretation:
lime "1H BUY": 1H conditions met, consider initial entry (stop-loss: 3-5% below recent low).
green "FULL BUY": 1H+4H conditions met, confirm trend for additional entry (take-profit: 10% below recent swing high).
Customization: Adjust TF (1H/4H), MACD/Stoch RSI parameters, and HMA usage via the input settings.
Alert Setup: Enable alerts for "ENTRY READY" (1H+4H) or "EARLY PING" (1H only) conditions.
Advantages
Accuracy: Reduces false signals by combining MACD golden cross below 0 with Stoch RSI oversold conditions.
Dual Confirmation: 1H for quick timing and 4H for trend validation, improving risk management.
Visualization: Past BUY points enable easy backtesting and pattern recognition.
Flexibility: 4H confirmation mode adjustable (histogram rise or golden cross).
Limitations
Timeframe Dependency: Optimized for 1H charts; may not work on other timeframes.
Market Conditions: Potential whipsaws in sideways markets; additional filters (e.g., RSI > 50) recommended.
Manual Management: Stop-loss and take-profit require user discretion.

Shamji's Liquidity Sweep + FVG (Follow-up + Filters) Purpose (what it does)
This indicator looks for two related price structures used by many smart-money / liquidity-hunt traders:
Liquidity Sweeps — candles that wick beyond a recent swing high (for buy-side stop-hunts) or swing low (for sell-side stop-hunts), then close back inside. These are flagged as potential stop-hunt events that clear obvious liquidity.
Fair Value Gaps (FVGs) — simple 3-bar style gaps where an older bar’s high is below the current low (bullish FVG) or an older bar’s low is above the current high (bearish FVG). When an FVG appears after a sweep (within a configurable window), this is considered a follow-up alignment.
The script adds optional filters (volume spike and candle-range vs ATR) to increase confidence, and can restrict marking/alerts to only events that meet the follow-up and filter rules.

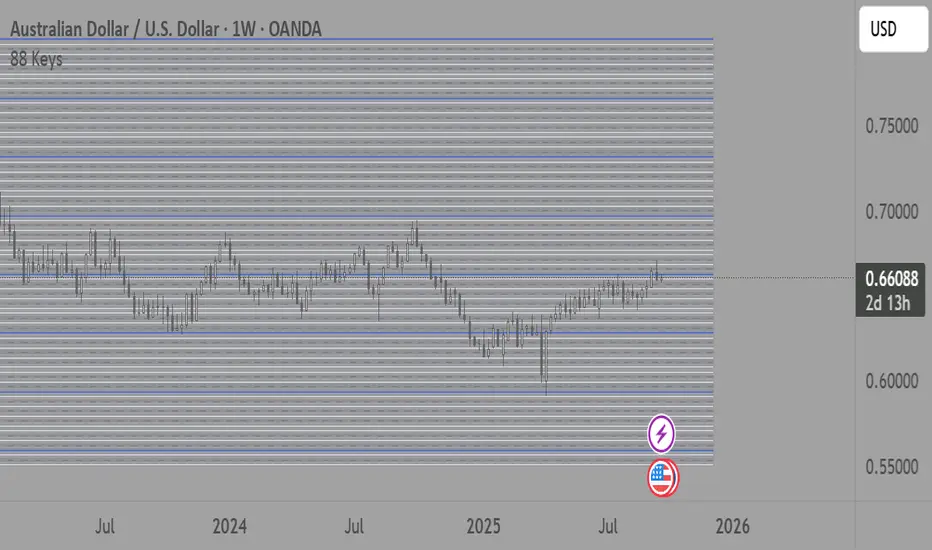
88-Key Piano Range - Musical Price Levels88-Key Piano Range - Musical Price Levels
Description:
Explore price analysis through musical harmony! This educational indicator maps price movements to the standard 88-key piano keyboard (A0 to C8), offering a creative way to visualize market ranges and explore harmonic price relationships with authentic keyboard-style background fills.
🎹 KEY FEATURES:
• Complete 88-Key Mapping - Full piano range from A0 to C8 mapped to your price range
• Piano-Style Visual Design - Clean background fills distinguishing white keys, black keys, and octaves
• Dual Anchor System - Set two time/price points to define your analytical range
• Flexible Display Options - Show all 88 keys, octaves only (C notes), or custom selections
• Harmonic Exploration - Explore consonant/dissonant key relationships based on music theory
• Real-time Price Note - See what musical note your current price represents
• Customizable Interface - Adjust colors, line widths, fills, and visual elements
🎵 EDUCATIONAL CONCEPTS:
• Octave Levels - C notes as harmonic reference points (similar to round numbers)
• Key Classifications - Natural notes (white keys) vs chromatic notes (black keys)
• Harmonic Intervals - Musical relationships applied to price analysis
• Creative Visualization - Alternative way to view price ranges and movements
⚙️ HOW TO USE:
1. Select Your Price Leg - Choose an upleg, downleg, or significant price movement to explore
2. Set Anchor A - Place at the start of your selected leg (swing low for upleg, swing high for downleg)
3. Set Anchor B - Place at the end of your selected leg (swing high for upleg, swing low for downleg)
4. Configure Display - Select all keys, octaves only, or enable background fills
5. Explore Harmonics - Enable harmony coloring to see musical relationships
6. Study Patterns - Observe how price movements align with musical intervals
🎼 CREATIVE APPLICATIONS:
• Experimental Analysis - Try a musical approach to leg analysis
• Educational Tool - Learn about mathematical relationships in both music and markets
• Alternative Perspective - View support/resistance through a musical lens
• Pattern Recognition - Explore if harmonic levels show interesting price behavior
• Fun Learning - Combine musical knowledge with trading concepts
📊 EXPERIMENTAL USE:
• Creative alternative to traditional Fibonacci levels
• Educational exploration of mathematical harmony in markets
• Interesting way to visualize price ranges and retracements
• Novel approach for musicians interested in trading concepts
Important Note: This is an educational and experimental tool that applies musical theory concepts to price analysis. It should be used for learning and exploration purposes alongside proven technical analysis methods. The musical relationships are mathematically based but not validated as reliable trading signals.
Katz Impact Wave 🚀Overview of the Katz Impact Wave 🚀
The Katz Impact Wave is a momentum oscillator designed to visualize the battle between buyers and sellers. Instead of combining bullish and bearish pressure into a single line, it separates them into two distinct "Impact Waves."
Its primary goal is to generate clear trade signals by identifying when one side gains control, but only when the market has enough volatility to be considered "moving." This built-in filter helps to avoid signals during flat or choppy market conditions.
Indicator Components: Lines & Plots
Impact Waves & Fill
Green Wave (Total Up Impulses): This line represents the cumulative buying pressure. When this line is rising, it indicates that bulls are getting stronger.
Red Wave (Total Down Impulses): This line represents the cumulative selling pressure. When this line is rising, it indicates that bears are getting stronger.
Colored Fill: The shaded area between the two waves provides an at-a-glance view of who is in control.
Lime Fill: Bulls are dominant (Green Wave is above the Red Wave).
Red Fill: Bears are dominant (Red Wave is above the Green Wave).
Background Color
The background color provides crucial context about the market state according to the indicator's logic.
Green Background: The market is in a bullish state (Green Wave is dominant) AND the Rate of Change (ROC) filter confirms the market is actively moving.
Red Background: The market is in a bearish state (Red Wave is dominant) AND the ROC filter confirms the market is actively moving.
Gray Background: The market is considered "not moving" or is in a low-volatility chop. Signals that occur when the background is gray should be viewed with extreme caution or ignored.
Symbols & Pivot Lines
▲ Blue Triangle (Up): This is your long entry signal. It appears on the bar where the Green Wave crosses above the Red Wave while the market is moving.
▼ Orange Triangle (Down): This is your short entry signal. It appears on the bar where the Red Wave crosses above the Green Wave while the market is moving.
Pivot Lines (Solid Green/Red/White Lines): These lines mark confirmed peaks of exhaustion in momentum, not price.
Green Pivot Line: Marks a peak in the Green Wave, signaling buying momentum exhaustion. This can be a warning that the uptrend is losing steam.
Red Pivot Line: Marks a peak in the Red Wave, signaling selling momentum exhaustion. This can be a warning that the downtrend is losing steam.
▼ Yellow Triangle (Compression): This rare signal appears when buying and selling exhaustion pivots happen at the same level. It signifies a point of extreme indecision or equilibrium that often occurs before a major price expansion.
Trading Rules & Strategy
This indicator provides entry signals but does not provide explicit Take Profit or Stop Loss levels. You must use your own risk management rules.
Long Trade Rules
Entry Signal: Wait for a blue ▲ triangle to appear at the top of the indicator panel.
Confirmation: Ensure the background color is green, confirming the market is in a bullish, moving state.
Action: Enter a long (buy) trade at the open of the next candle after the signal appears.
Short Trade Rules
Entry Signal: Wait for an orange ▼ triangle to appear at the bottom of the indicator panel.
Confirmation: Ensure the background color is red, confirming the market is in a bearish, moving state.
Action: Enter a short (sell) trade at the open of the next candle after the signal appears.
Take Profit (TP) & Stop Loss (SL) Ideas
You must develop and test your own exit strategy. Here are some common approaches:
Stop Loss:
Place a stop loss below the most recent significant swing low on the price chart for a long trade, or above the recent swing high for a short trade.
Use an ATR (Average True Range) based stop, such as 2x the ATR value below your entry for a long, to account for market volatility.
Take Profit:
Opposite Signal: The simplest exit is to close your trade when the opposite signal appears (e.g., close a long trade when a short signal ▼ appears).
Momentum Exhaustion: For a long trade, consider taking partial or full profit when a green Pivot Line appears, signaling that buying momentum is peaking.
Fixed Risk/Reward: Use a predetermined risk/reward ratio (e.g., 1:1.5 or 1:2).
Disclaimer
This indicator is a tool for analysis, not a financial advisor or a guaranteed profit system. All trading and investment activities involve substantial risk. You should not risk more than you are prepared to lose. Past performance is not an indication of future results. You are solely responsible for your own trading decisions, risk management, and for backtesting this or any other tool before using it in a live trading environment. This indicator is for educational purposes only.

Swing Cross NotifierThis indicator identifies swing highs and lows on the chart and draws horizontal lines at these levels.
It is designed to send an alert when the price first crosses a swing level and then closes with a reversal candle within a user-defined number of bars.
**How to Use for Alerts:**
1. Add the indicator to your chart.
2. Create an Alert.
3. In the "Condition" dropdown, select this script's name.
4. Choose "Any alert() function call".
5. Set the trigger to "Once Per Bar Close".

ICT FVG Buy/Sell SignalsThis bot is built on ICT (Inner Circle Trader) concepts such as:
Fair Value Gaps (FVGs) – imbalance zones between candles.
Consequent Encroachment (CE) – the midpoint of a gap.
Premium / Discount Arrays – dealing ranges split into premium (sell-side) and discount (buy-side) zones.
Displacement candles – strong impulsive moves that confirm intent.
The bot scans for FVGs, marks CE levels, and waits for price to return to these levels.
When price revisits a valid FVG zone with displacement confirmation and in the correct PD array, the bot generates a BUY or SELL signal.
✅ Signal Rules
Buy Signal
Price trades back into a Bullish FVG.
Current bar shows bullish displacement (large bullish body relative to ATR).
Price is in discount territory of the current dealing range (if PD filter is enabled).
Close is above the CE line of the FVG.
Sell Signal
Price trades back into a Bearish FVG.
Current bar shows bearish displacement.
Price is in premium territory of the current dealing range.
Close is below the CE line of the FVG.
🎯 What You’ll See on the Chart
Green “BUY” labels below candles when long signals trigger.
Red “SELL” labels above candles when short signals trigger.
Shaded background:
Red = Premium zone (sell side).
Teal = Discount zone (buy side).
Yellow line = dealing range midpoint (equilibrium).
Dots on CE lines = midpoints of the latest bullish/bearish FVG.
🔔 Alerts
ICT Buy → Triggers when a bullish setup confirms.
ICT Sell → Triggers when a bearish setup confirms.
You can connect these alerts to:
TradingView notifications.
Webhooks (for brokers or bots like MetaTrader, NinjaTrader, or Discord).
⚙️ Settings
Swing length – how many bars to use when detecting swing highs/lows for the dealing range.
Use PD filter – toggle ON/OFF for requiring discount/premium alignment.
Displacement ATR multiple – how strong the candle body must be compared to ATR to count as a displacement.
ATR length – used for displacement filter.
📈 Supported Markets
Works on all symbols and timeframes.
Commonly applied to:
NASDAQ (NQ, QQQ)
S&P500 (ES, SPX, SPY)
Forex pairs
Crypto (BTC, ETH, etc.)
⚠️ Disclaimer
This bot is for educational purposes only. It does not guarantee profits and should be tested on demo accounts first.
Always apply proper risk management before trading live.

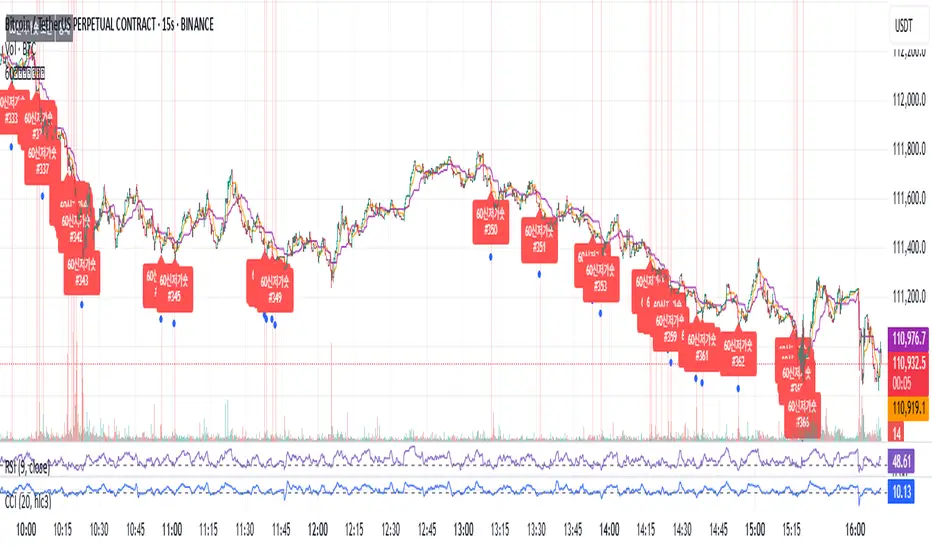
60 신저가 숏_신저가“60-Day New Low Short (New Low)” is a momentum breakdown setup that sells short when price prints a fresh 60-day low, aiming to ride continued weakness after support fails.
Enter on the breakdown close (or next open) with confirmation such as expanding volume, relative weakness vs. a benchmark, and price below the 50/200-day MAs.
Manage risk with a stop above the recent swing high or 20-day high; take profits via ATR-based targets or a trailing stop, and be cautious around earnings/news catalysts.
